Published November 20, 2026 · By
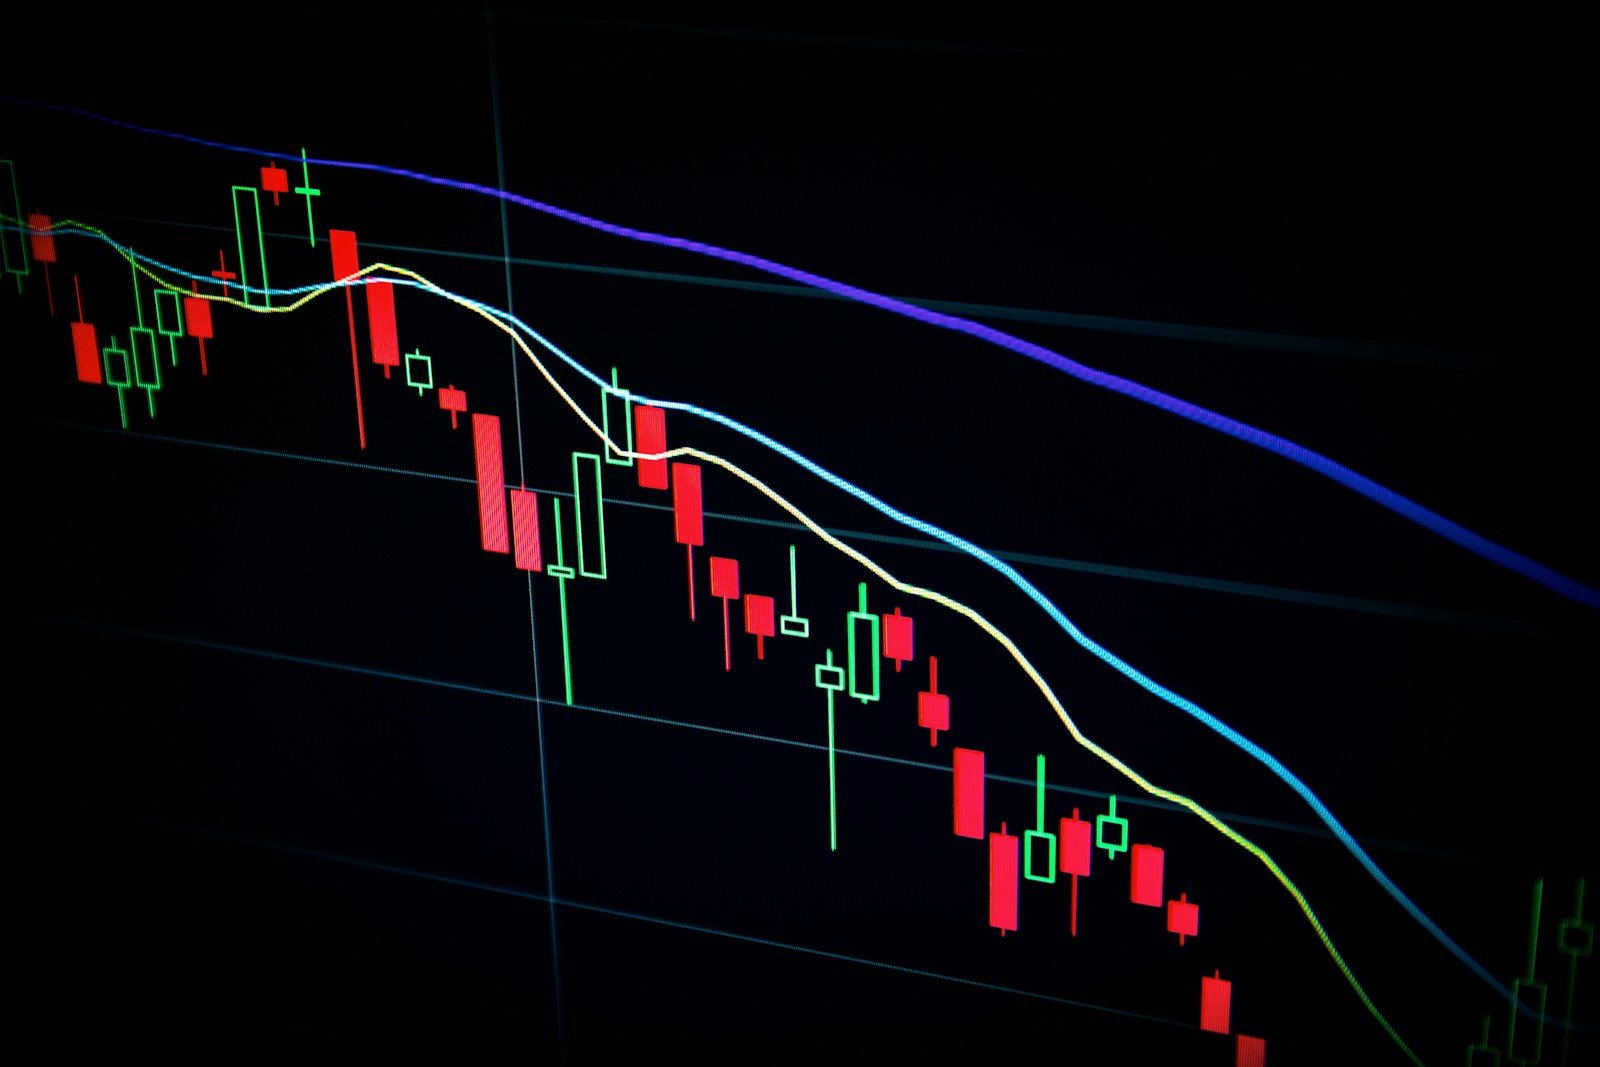
The VIX volatility index, Wall Street's best-known gauge of expected stock swings, climbed above 30 on Friday, Nov. 20, for the first time since late March. The jump came as a selloff in artificial intelligence and chip stocks spread across global markets and investors weighed the chance of more Federal Reserve rate hikes. Figures in this report reflect trading through late Friday morning, Eastern time, and may change by the close.

VIX Volatility Index Breaks Above 30
Reuters reported that the VIX volatility index touched 30.04 in premarket trading, its highest level since March 30. CNBC put the early reading near 30.99. By about 10:47 a.m. ET, Investing.com data showed the gauge at 30.52, up about 7% on the day.
The move built on Thursday's surge. The VIX volatility index closed Thursday at 28.44, up 3.88 points, or nearly 16%, from 24.56. That same day, the Dow Jones Industrial Average lost 1,101 points to close at 49,097.06, and the S&P 500 fell 2.02% to 7,175.83. All 11 S&P sectors finished lower, as we reported in our coverage of the Thursday stock market selloff.
A VIX volatility index reading above 30 is generally seen by traders as a sign of elevated fear. For most of the past year, the gauge traded well below that level.
How the Major Indexes Traded Friday
At about 10:47 a.m. ET, the S&P 500 was at 7,081.77, down 1.31%, and the Nasdaq 100 was down 2.91%, according to Investing.com. The Dow, which holds fewer chip stocks, swung between small gains and losses during the morning.
Citing Bloomberg, Investing.com noted that a lower close on Friday would give the S&P 500 its seventh straight losing session, the longest such run since February 2020. CNBC data cited by StockTitan showed the Dow about 10% below its record, which meets the common definition of a correction, and down roughly 6.2% for the week.
Why the VIX Volatility Index Is Rising
Reuters linked the broad selloff to several overlapping worries: concerns that the AI and tech boom has run too far, expectations that the Fed will need more rate hikes to bring down inflation, doubts about data center construction after the midterm elections, and the sudden resignation of Nvidia CEO Jensen Huang earlier this month.
Chip Stocks and the Anthropic IPO
Chipmakers led Friday's decline. As of 11:02 a.m. ET, Nvidia was down about 6.7% at $136.20, AMD was down about 10%, Micron was off about 11% and Broadcom was down about 9%, according to StockTitan. AMD had already fallen 7.72% on Thursday after a short-seller report from Hunterbrook.
Shares of Anthropic, which began trading Thursday after a record initial public offering priced at $83, fell about 11% on Friday morning to around $86. That was still slightly above the IPO price but well below Thursday's first trade of $111.50.
Global Markets Under Pressure
The pressure was global. CNBC reported that Japan's Nikkei fell 5.06%, South Korea's Kospi dropped 5.21% and Taiwan's Taiex lost 5.65% on Friday. Reuters said Taiwan's market was down about 17% for the week, its biggest weekly fall since the early 1990s, and that nearly $9 trillion has been wiped off world stock values since August. The VIX volatility index tracks only U.S. options, but the global selling fed directly into demand for protection on Wall Street.
The Federal Reserve Factor
Rate expectations are part of the picture. The Fed's target range is 3.75% to 4%. Philadelphia Fed President Anna Paulson said Thursday that the central bank would need to raise rates again. Fed Governor Christopher Waller said in a Nov. 10 speech that he supports a December hike and that a half-point move should be considered if core inflation stays high. As Waller put it, "Hiking only 25 basis points would put our credibility at risk." Our earlier report on the half-point rate hike debate covers the Fed minutes in detail.
The Fed's official meeting calendar, statements and minutes are published on the Federal Reserve website. Fed Governor Lisa Cook was scheduled to speak at 12:15 p.m. ET Friday.
What Analysts Said About the VIX Volatility Index Spike
Market strategists offered different readings of the moment. Bruno Schneller, managing director at Erlen Capital Management, told Reuters he was concerned the tech correction could spread into broader financial markets. He added that gold's failure to act as a safe haven suggested investors may be raising cash.
Bénédicte Lowe of BNP Paribas described the activity as panic selling, as investors try to judge whether AI enthusiasm has peaked. Binky Chadha of Deutsche Bank took a different view, calling the market very oversold and noting that economic growth and corporate earnings remain strong.
Citi analysts, in a note cited by Reuters, said markets could start to price out further U.S. rate hikes, which would support bonds, if the stock selloff turns into a bursting of the AI bubble.
Bonds, Gold and the Dollar
Treasury yields fell as investors moved toward safer assets. The 10-year yield traded near 4.94% to 4.99% Friday morning. Reuters said it was on track for its biggest weekly decline since April 2025, down about 17 basis points this week. Gold fell to its lowest level since September 2025, while the dollar index hit a 19-month high earlier in the week.
Not all of Friday's data was negative. The University of Michigan's final November reading of consumer sentiment rose to 51.5 from 48.0 in October.
What the VIX Volatility Index Measures
The VIX volatility index is calculated by Cboe Global Markets from S&P 500 options prices. It reflects how much movement traders expect in the index over the next 30 days. When investors rush to buy protection against losses, options prices rise and the gauge goes up. That is why it is often called Wall Street's fear gauge.
Our analysis: the VIX volatility index measures expected swings, not direction. A high reading signals uncertainty, but it does not predict whether stocks will rise or fall next. Friday also brought monthly options expiration, which can add to short-term price swings.
What It Means for You
For most Americans, the VIX volatility index matters through retirement and brokerage accounts. Here is how the current market may touch your finances, based on the facts above.
Your 401(k) and IRA
If you hold an S&P 500 or Nasdaq index fund, your balance has likely dropped this week. Funds heavy in technology have been hit hardest. Large daily swings are more common when the VIX volatility index is above 30, so account values may move sharply for a while. Reviewing your mix of stocks and bonds against your timeline can help you decide whether any change fits your goals.
Borrowing and Saving
Falling Treasury yields can eventually ease some borrowing costs, but the Fed is still discussing rate hikes. Mortgage and credit card rates remain high. Savers, meanwhile, are still earning elevated yields on high-yield savings accounts, money market funds and short-term Treasury bills.
What to Watch Next
- Friday's market close, which will show whether the S&P 500 losing streak reaches seven days.
- Upcoming remarks from Fed officials ahead of the December policy meeting.
- Further trading in Nvidia, AMD and Anthropic, which have led the AI selloff.
- Holiday shopping data in the week of Thanksgiving.
Whether the VIX volatility index stays above 30 will depend on how markets absorb the AI selloff and the Fed's next steps. Historically, investors with long time horizons have often been advised by planners not to make decisions based on one volatile week.
This article is for information only and is not financial advice.
Sources: Reuters (via Yahoo Finance), Investing.com, CNBC (via StockTitan), Bloomberg, Trading and Investment News, Federal Reserve (federalreserve.gov).