Published November 21, 2026 · By
The Nasdaq selloff deepened sharply on Friday, Nov. 20, as the tech-heavy index fell 5.3% and wiped out all of its gains for 2026. The S&P 500 dropped 3.7% and joined the Dow Jones Industrial Average in correction territory, according to The Associated Press. A steep slide in artificial intelligence and chip stocks, led by a roughly 14% drop in Nvidia, drove the losses, while expectations of another Federal Reserve rate hike added pressure.
Nasdaq Selloff by the Numbers
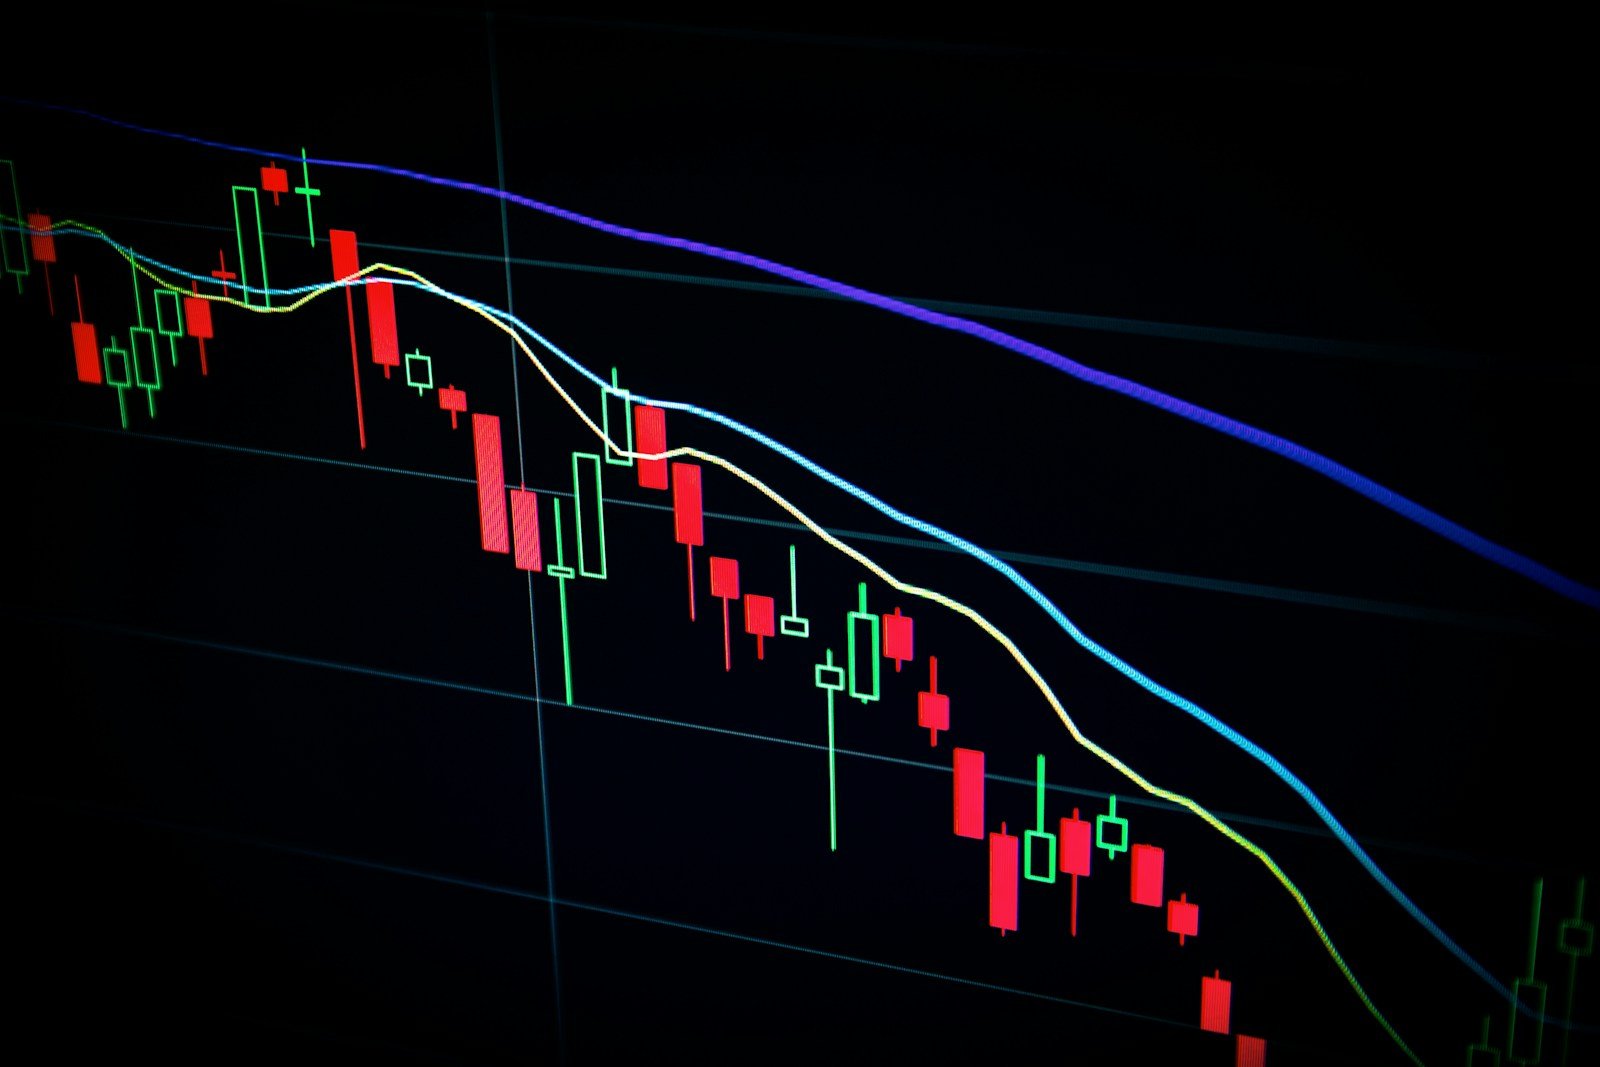
The Nasdaq Composite lost 1,261.47 points on Friday to close at 22,617.73, AP data show. That left the index down 2.7% for the year. The S&P 500 fell 265.44 points to 6,910.39, and the Dow dropped 949.73 points, or 1.9%, to 48,147.33. The Russell 2000 index of smaller companies slid 2.8% to 2,581.79.
The weekly damage was even larger. The Nasdaq fell about 10% over five trading days, the S&P 500 lost 8.6% and the Dow gave up 8%. AP said it was the S&P 500's worst week in more than 18 months. Friday also marked the benchmark's seventh straight losing session.
Correction Territory for the S&P 500 and Dow
A correction is commonly defined as a decline of at least 10% from a recent peak. The S&P 500 closed more than 10% below its Oct. 6 record, according to AP, and the Dow also ended more than 10% below its own high. The S&P 500's last correction came in March 2025. Even after the Nasdaq selloff, the S&P 500 remained up 0.9% for 2026 and the Dow was up 0.2%.
Volatility rose with the losses. The Cboe Volatility Index, often called Wall Street's fear gauge, climbed above 30 for the first time since March. Our earlier report on the stock market correction covered how the slide built through the week.
How the Nasdaq Selloff Compares
The Nasdaq selloff stood out even within a rough week for stocks. The Composite's 5.3% one-day drop was larger than the S&P 500's 3.7% decline and nearly three times the Dow's 1.9% loss. That gap reflects how heavily the Nasdaq leans on technology and chip companies. By contrast, the Russell 2000 is still up 4% for the year, a sign that the Nasdaq selloff has been concentrated in the market's largest tech names rather than spread evenly.
What Drove the Nasdaq Selloff
Chipmakers and other AI-linked companies took the heaviest hits. Nvidia fell about 14% on Friday, completing seven straight weekly declines, its longest losing streak since the 2008 financial crisis, CNBC reported. The drop came even though the company reported quarterly results this week that topped Wall Street forecasts. Nvidia has also been dealing with a leadership change after Jensen Huang stepped down as CEO earlier this month.
Other chip stocks fell by similar amounts. AMD lost about 13.3%, Micron about 13.9% and Broadcom about 12.1%, according to AP figures. The PHLX Semiconductor Index dropped 10.7%. Because these companies carry large weights in the index, their declines drove much of the Nasdaq selloff.
Anthropic Shares Give Back Gains
Anthropic, the AI company that began trading publicly on Thursday after pricing its initial public offering at $83 a share, fell 9.1% to $88.30 on Friday, AP reported. The stock remained above its offering price but well below its first-day intraday peak. CNN reported that the IPO failed to calm investor nerves about AI valuations, and some market coverage linked part of the Nasdaq selloff to profit-taking after the debut.
Questions About AI Spending
Many analysts pointed to growing doubts about whether heavy spending on AI data centers will pay off. Michael Antonelli, a market strategist at Baird, told AP that investors are questioning "the whole notion that AI can continue to spend unlimited amounts of money." He added that he does not believe the bull market that began in October 2022 has ended.
Bénédicte Lowe of BNP Paribas told CNBC that investors were engaged in "panic selling" as they weighed whether AI enthusiasm has peaked. Binky Chadha of Deutsche Bank offered a different view, telling CNBC the market looked very oversold and that, in his assessment, economic growth and corporate earnings remain strong.
The Federal Reserve and Interest Rates
Interest rate expectations formed the backdrop for the Nasdaq selloff. Minutes from the Fed's Oct. 27-28 meeting, released Nov. 18, showed that almost all officials viewed further rate increases as likely appropriate under their baseline outlook. The Fed held its benchmark rate at 3.75% to 4% in October, with two members preferring a quarter-point hike.
Fed Governor Lisa Cook said this week that waiting longer to raise rates risks getting behind the curve on inflation, as we reported in our coverage of Lisa Cook's warning. Philadelphia Fed President Anna Paulson also said rates will need to rise again. Futures markets priced in a high chance of a hike at the Fed's December meeting, according to CME FedWatch data cited in market reports. The Fed's schedule is posted on its official meeting calendar.
President Trump has repeatedly urged the Fed to lower rates and has criticized the central bank as political, while Fed officials have said their decisions are based on economic data. Bond prices rose on Friday as investors sought safety: the 10-year Treasury yield fell to 4.93% from 5.04% late Thursday, according to AP.
Global Markets Feel the Nasdaq Selloff
The pressure was not limited to Wall Street. Market reports said Taiwan's benchmark index, heavy with chip manufacturers, fell about 5.65% for its steepest weekly drop since October 1997. Japan's Nikkei and South Korea's Kospi each lost roughly 5%, while European stocks posted smaller declines.
Consumers are also watching. The University of Michigan's final November survey put consumer sentiment at 51.5, up from 48 in October, but its director noted that households holding stocks reported weaker finances, a pattern the survey linked to AI-related turbulence in markets.
What It Means for You
For most Americans, the Nasdaq selloff shows up first in retirement accounts. Many 401(k) plans and IRAs hold broad index funds or target-date funds with large positions in big technology companies, so balances may look noticeably lower on recent statements. A paper loss becomes a realized loss only when shares are sold.
Retirement Savers and Long-Term Investors
Our analysis: historically, corrections have been a regular part of investing, and many have not turned into bear markets, which are declines of 20% or more. Savers with decades until retirement often keep regular contributions going, which buys more shares when prices are lower. People close to retirement may want to review whether their mix of stocks, bonds and cash still matches their timeline.
The U.S. Securities and Exchange Commission offers free tools on diversification and asset allocation at Investor.gov, which can help you check whether your portfolio is spread across different kinds of investments.
Our analysis: the Nasdaq selloff is a reminder that a portfolio tilted heavily toward a few large tech stocks can swing more than a broadly diversified one. Checking how much of your savings sits in technology funds is a simple first step.
Borrowers and Savers
If the Fed raises rates in December, borrowing costs on credit cards, home equity lines and other variable-rate loans would likely rise. Savers, on the other hand, could see higher yields on savings accounts, certificates of deposit and money market funds. Mortgage rates track longer-term Treasury yields, which eased on Friday but remain near multiyear highs.
What to Watch Next
Key events ahead include the Fed's December policy meeting, further comments from Fed officials, upcoming inflation data and further news from Nvidia, including its leadership transition. Investors will also watch whether buyers return to AI stocks after the Nasdaq selloff or whether the pullback widens.
This article is for information only and is not financial advice.
Sources: The Associated Press (via Yakima Herald-Republic), CNBC, CNN, Federal Reserve, University of Michigan Surveys of Consumers, Investor.gov.